This guide will walk you through how to select a station on a map, view meta data and visualize a time series. Prior to completing this tutorial, please reviews steps 1-3 in the Download A Map tutorial.
1. Select a station
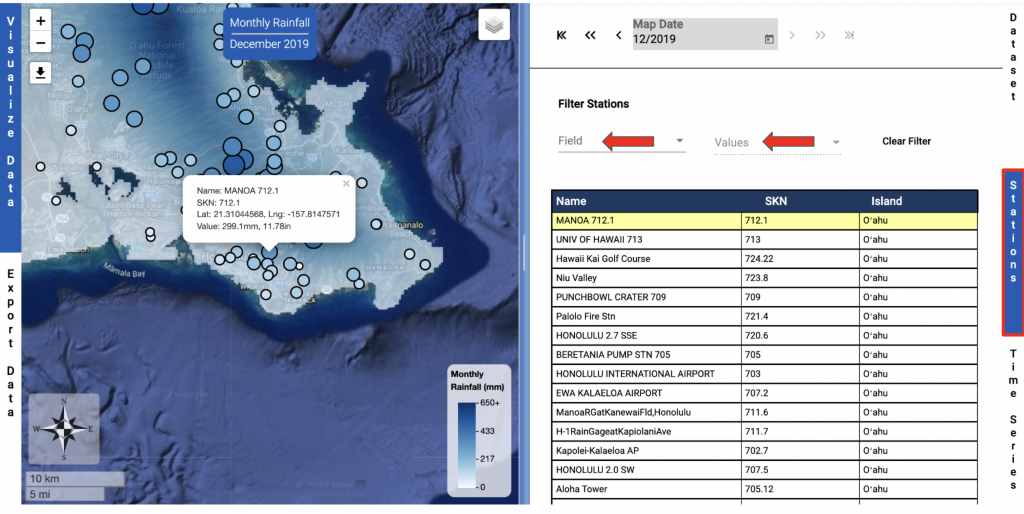
All stations can be viewed by clicking on Stations or scrolling down to the Stations section on the data selection side of the page. Individual stations on the map can be viewed by clicking on a station on the map or by clicking on a station in the table. Once a station is selected it will be highlighted. Stations can be filtered by selecting a field and selecting or typing in a value.
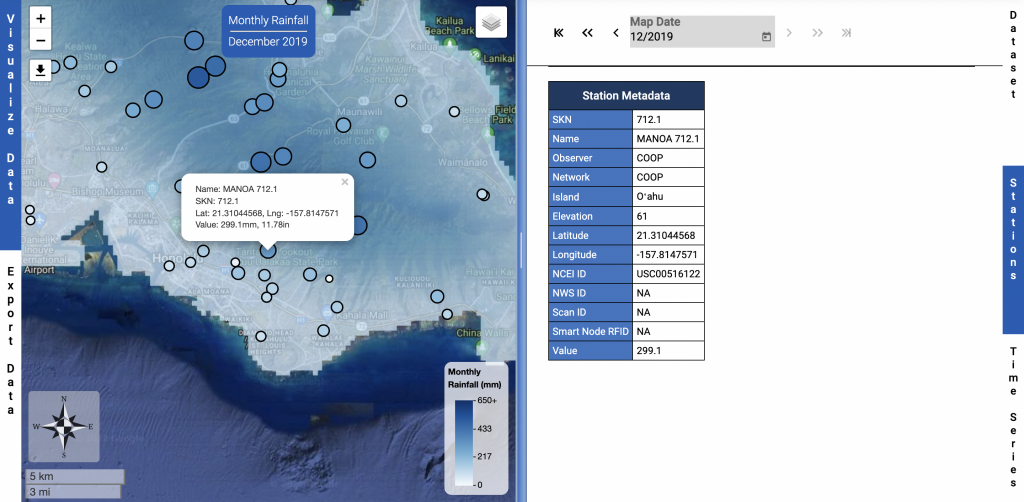
Metadata from the station can be viewed by scrolling to the bottom of the stations section.
2. Create A Time Series
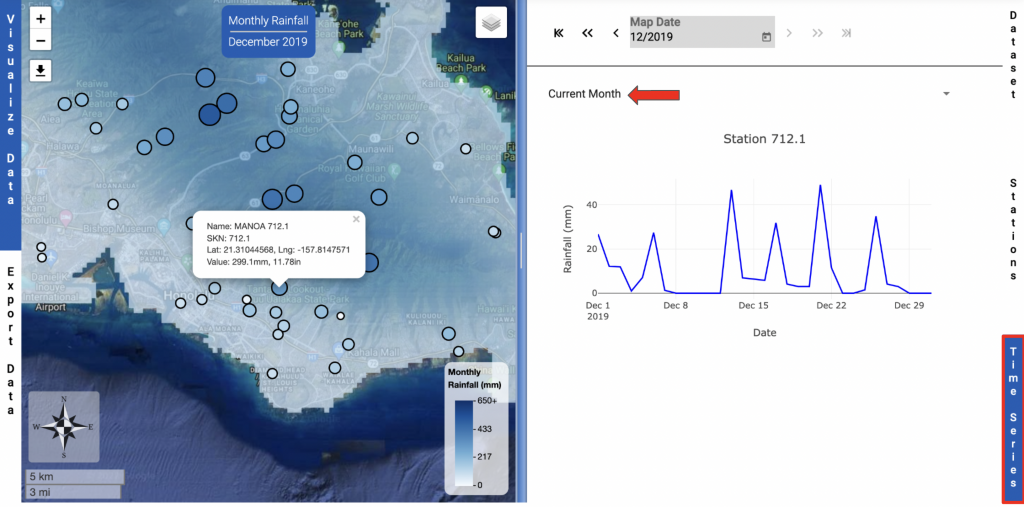
A time series of a selected station can be viewed by clicking on Time series or scrolling down to the Time series section on the data selection side of the page. Data from the current month will be displayed automatically. If you would like a longer time series you can select “Current Year” or “All Values” from the drop down menu.
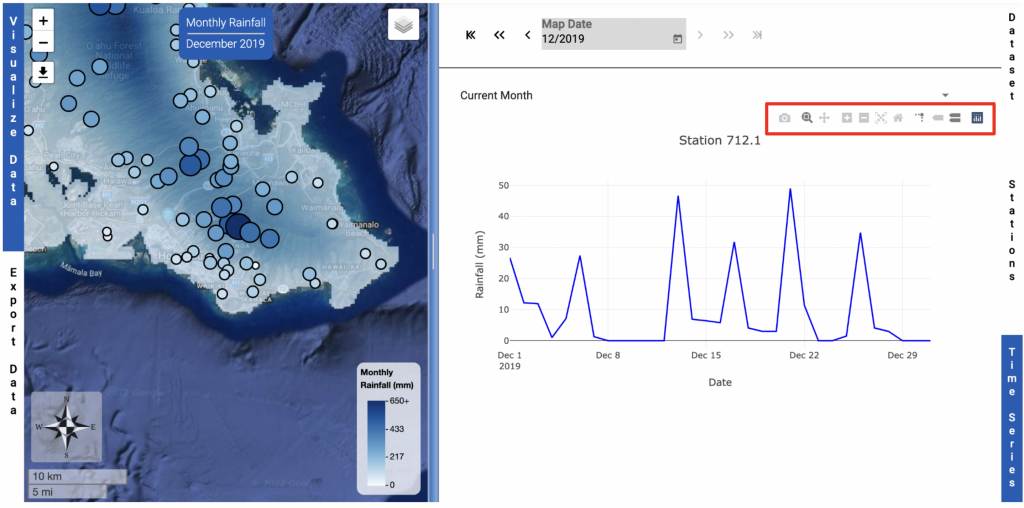
The size of the time series can be adjusted by moving the slider in the middle of the page. The axes on the time series can be moved by clicking and dragging them.
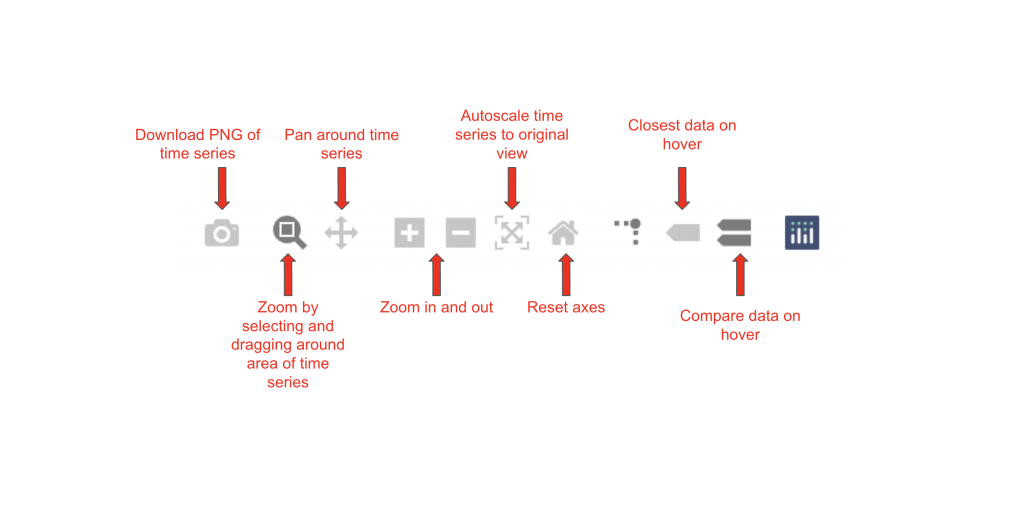
The tool bar can be used to make further adjustments.
3. Resize and Download Time Series
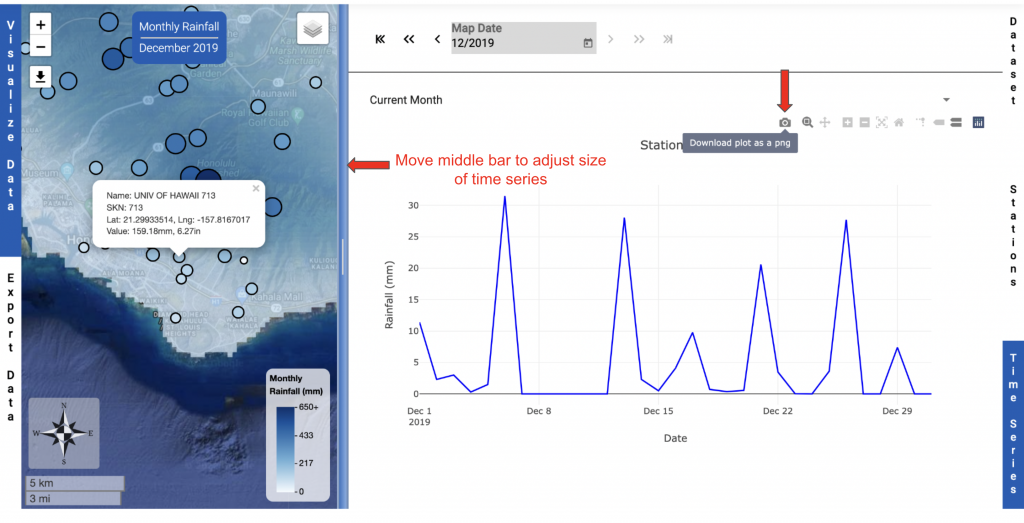
Once the map has desired appearance, click the download button to download a PNG of the map. Note: The dimensions of the time series image will change if the slider in the middle of the page is moved to make the time series section smaller or larger. You may need to adjust your browser in combination with the slider to get the desired time series image size.