This experiment has achieved the goal of slowing down nutrient cycling in the forest; nutrient cycling is at least 80% lower, regardless of treatment! Moderate redundant plots have shown the most combined survival and growth of outplants. Redundant plots have the greatest native seedling recruitment. Moderate complementary plots appear to be the least resistant against invasive species.
 ʻIeʻie (Freycinetia arborea) is only typically found in lowland wet forests, and is an indicator of a healthy forest. We have found ʻieʻie growing in many of our plots!

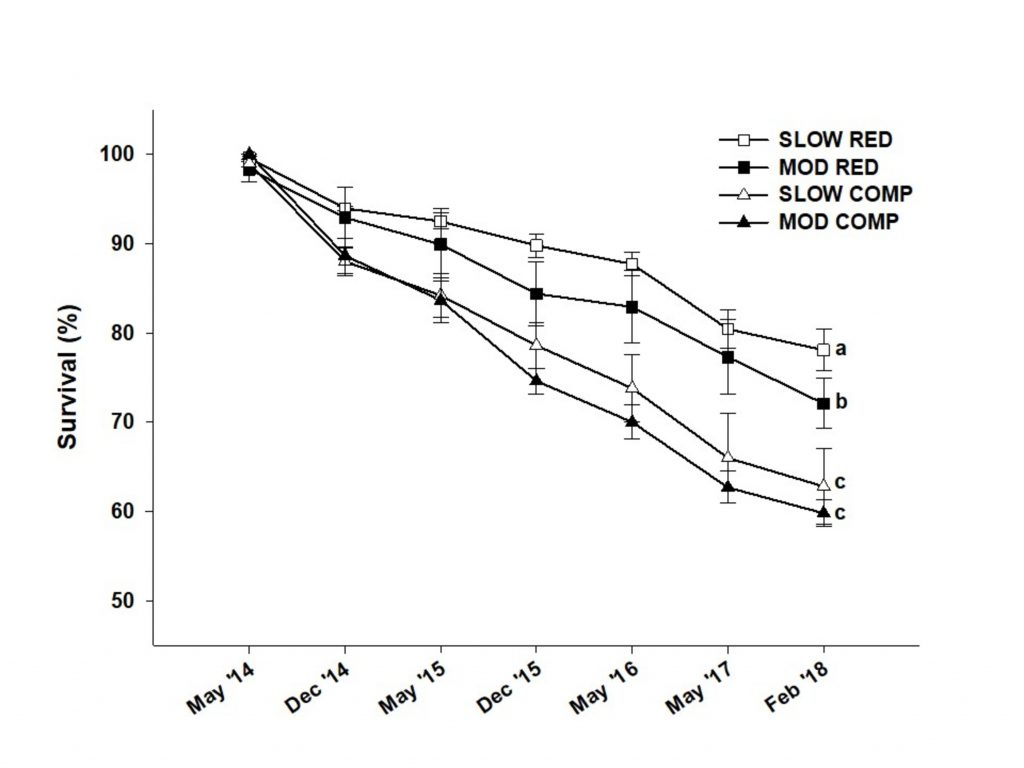
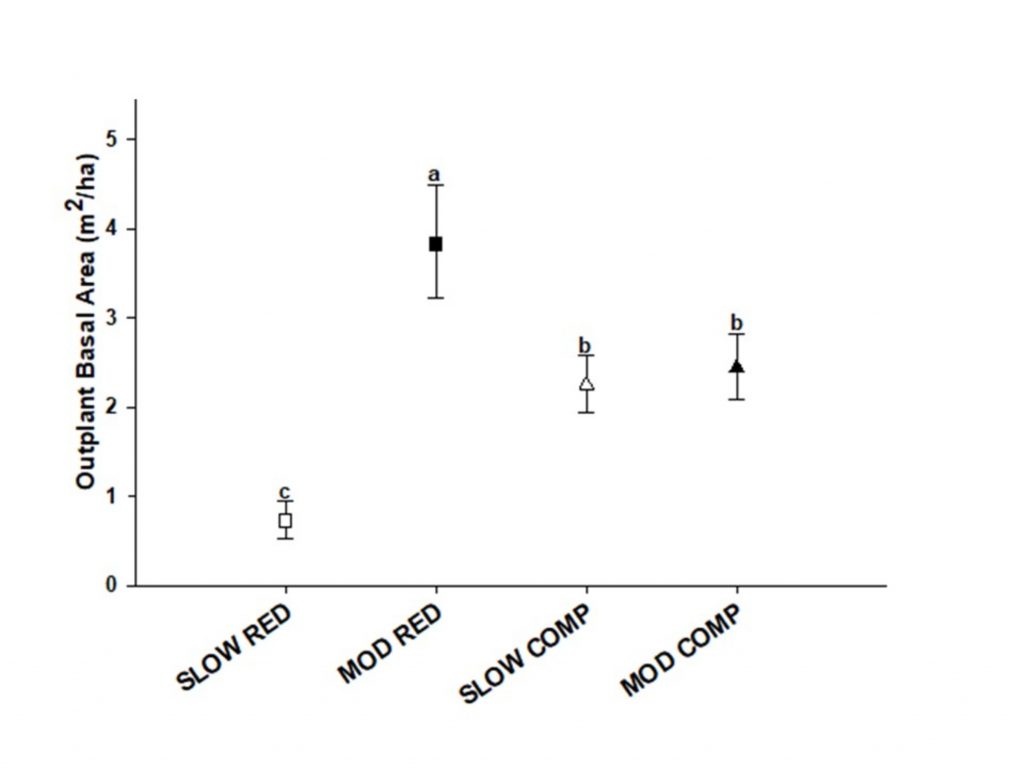
Survival and Growth
Slow redundant plots have the greatest outplant survival over the years, with moderate redundant in second (Figure 9). However, slow redundant sees the lowest growth based on basal area, while moderate redundant plots have the greatest (Figure 10). Some outplants that did especially well in terms of survival and growth include kukui, ʻulu, mango, false kamani, neneleau, avocado, kamani, and ʻōhiʻa ʻai. On the other hand, māmaki, hame, and kōlea lau nui had very low survival.
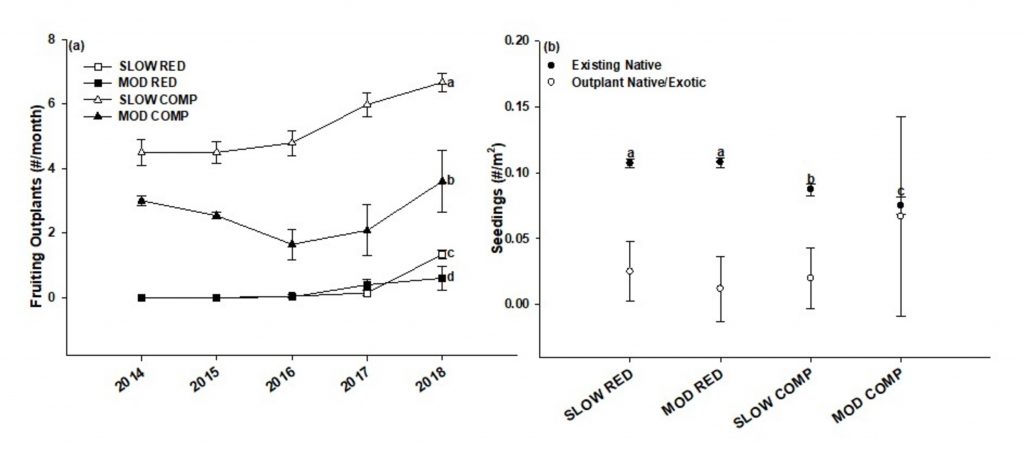
Reproduction and Regeneration
Slow complementary plots show the greatest amount of fruiting, and moderate redundant had the second most fruiting. For all plots but moderate complementary, existing native plants have significantly more seedlings than outplants (Figure 11a). Existing native recruitment was greatest form slow redundant and moderate redundant, and lowest for moderate complimentary (Figure 11b).
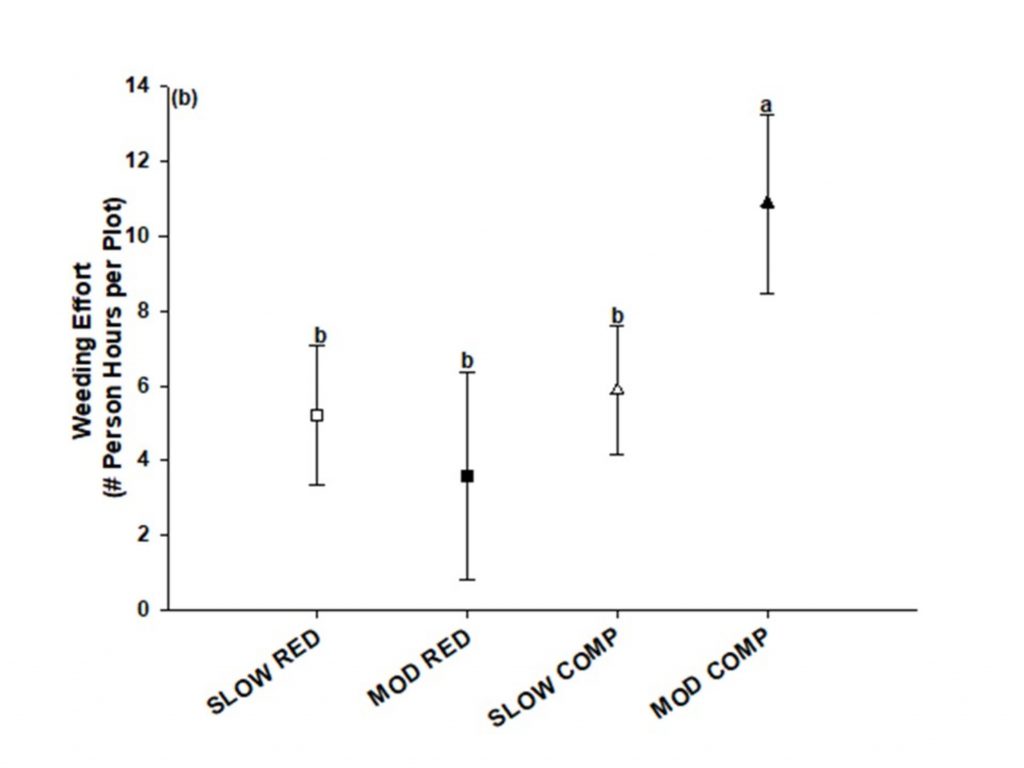
Invasion Resistance
Weeding effort is greater in moderate complementary plots than all other treatments (Figure 12), suggesting it is the least resistant to invasive species encroachment.
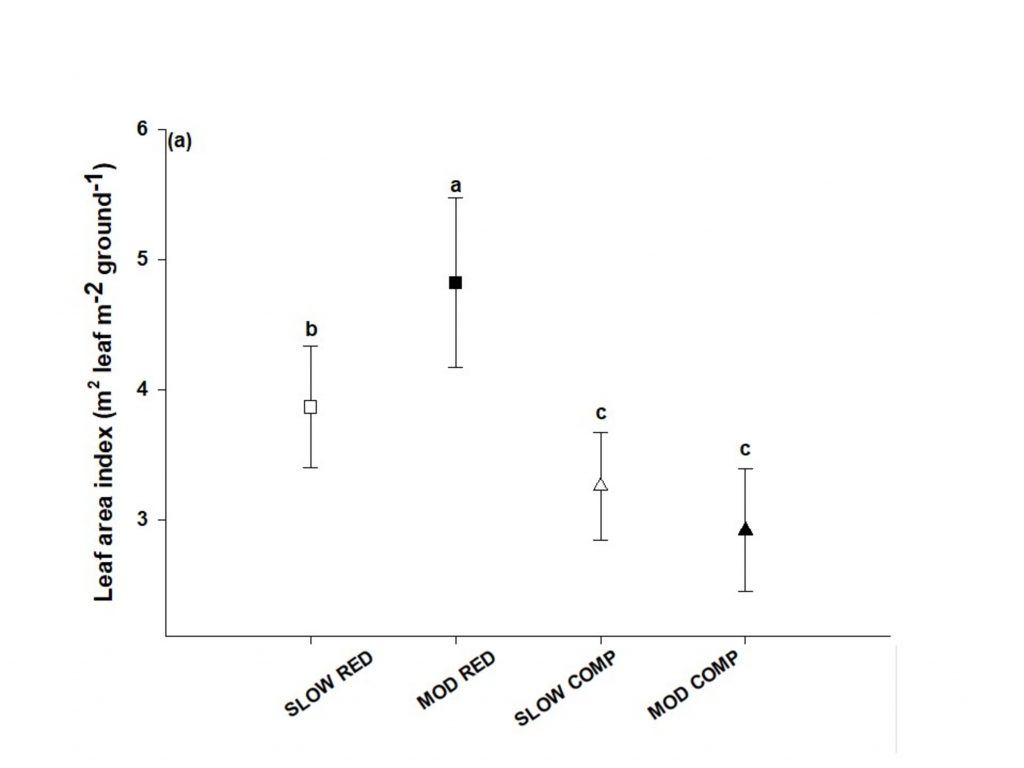
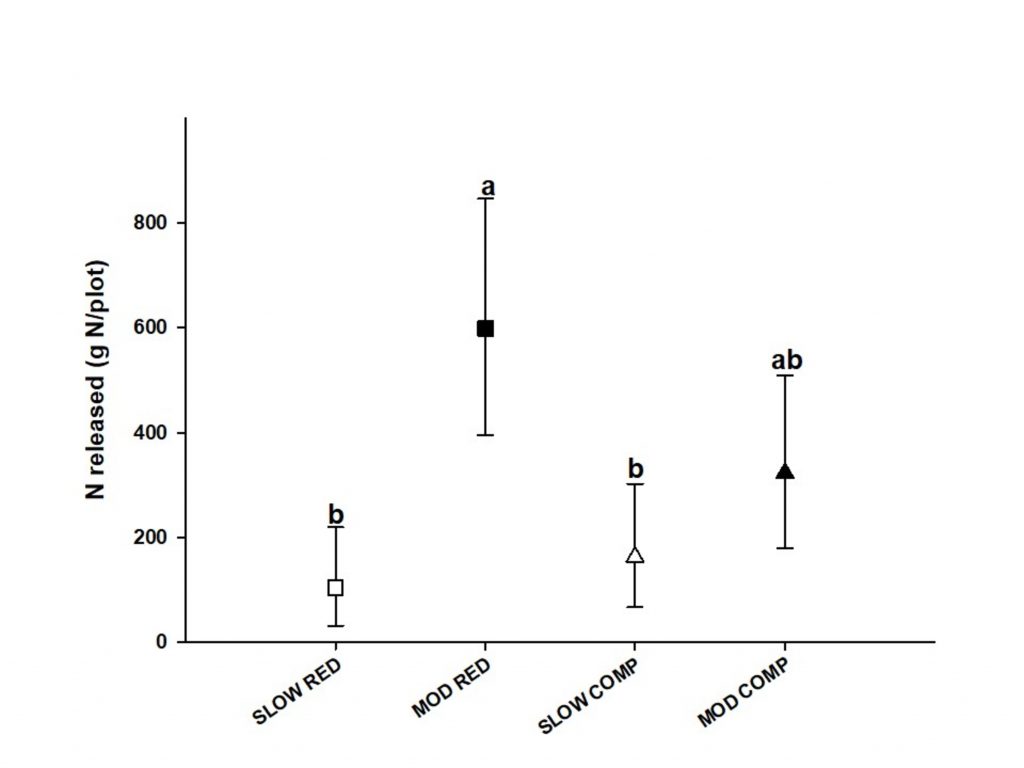
Nutrient Cycling
Different functional traits modify the environment in different ways. One goal of this project was to reduce light levels in the understory as well as the rate of nutrient cycling to make the forest lest prone to invasion. A greater leaf area index equates to more leaf layers in the canopy and therefore a darker understory. Moderate redundant plots had the greatest leaf area index, whereas slow complimentary and moderate complementary plots had the lowest (Figure 13). Moderate redundant plots also had the greatest amount of nutrients released from litterfall, significantly more than slow redundant and slow complimentary plots (Figure 14).