
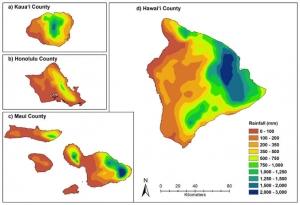
Rainfall map accuracy is vital in climate and hydraulic modeling and supports environmental management decision making, water resource planning and weather forecasting. University of Hawaiʻi and East-West Center researchers have developed more accurate monthly rainfall maps by using machine learning. According to IBM, machine learning is a branch of artificial intelligence (AI) and computer science that focuses on the use of data and algorithms to imitate the way that humans learn, gradually improving its accuracy.
Funded by the National Science Foundation’s Hawaiʻi EPSCoR ʻIke Wai project, a team of researchers used a machine learning technique to detect erroneous rainfall maps. The results of this study were recently published in the Journal of Hydrometeorology.
“This approach demonstrates how, with a moderate amount of data, a low-level machine learning algorithm can be used to train, evaluate and classify an unrealistic map output,” said lead author Matthew Lucas, a climate data analyst for the UH Water Resources Research Center. “This allows for minor corrections of automated interpolation (the process of calculating an approximate value based on values that are already known) that can produce a much more accurate and realistic map of the spatial patterns of rainfall. If this workflow can work in Hawaiʻi with its extreme climate gradients it can definitely work elsewhere.”
Supported with computational resources from Mana, the UH high performance computing cluster, this finding was made during the development of the Hawaiʻi Climate Data Portal (HCDP), which was made publicly available this past March. The online portal offers an innovative automated solution that works well and preserves the overall accuracy of the map outputs.
The study resulted in high-resolution, gridded monthly rainfall time series data for the state of Hawaiʻi spanning a period of 30 years. Rainfall maps range from as early as 1990 up to 2019 using data from more than 600 weather observation stations located throughout the islands.
“Having a wide range of gridded products will allow researchers the opportunity to develop important decision support for the state such as fire, flood and drought risk and early warning systems,” said co-author Ryan Longman, an Oceania research fellow at East-West Center. “Now that high-quality rainfall maps are available in near-real-time, researchers can spend less time processing data and more time answering important questions that can help us better understand and adapt to changing environmental conditions.”
In addition to ongoing improvements of current climate data products, researchers are in the process of developing methods to automate the production of daily rainfall maps and other gridded climate products for the state of Hawaiʻi. All data products are available for data visualization and download to the public through the Hawaiʻi Climate Data Portal.
- Related UH News story: Revolutionary climate data portal critical to future planning, March 3, 2022
—By Maria Dumanlang